This project required synthesis from multiple CDC flu databases including influenza deaths, vaccination rates,
flu testing data, and was supplemented with hospital data, including numbers for monthly revenue, from statista.com.
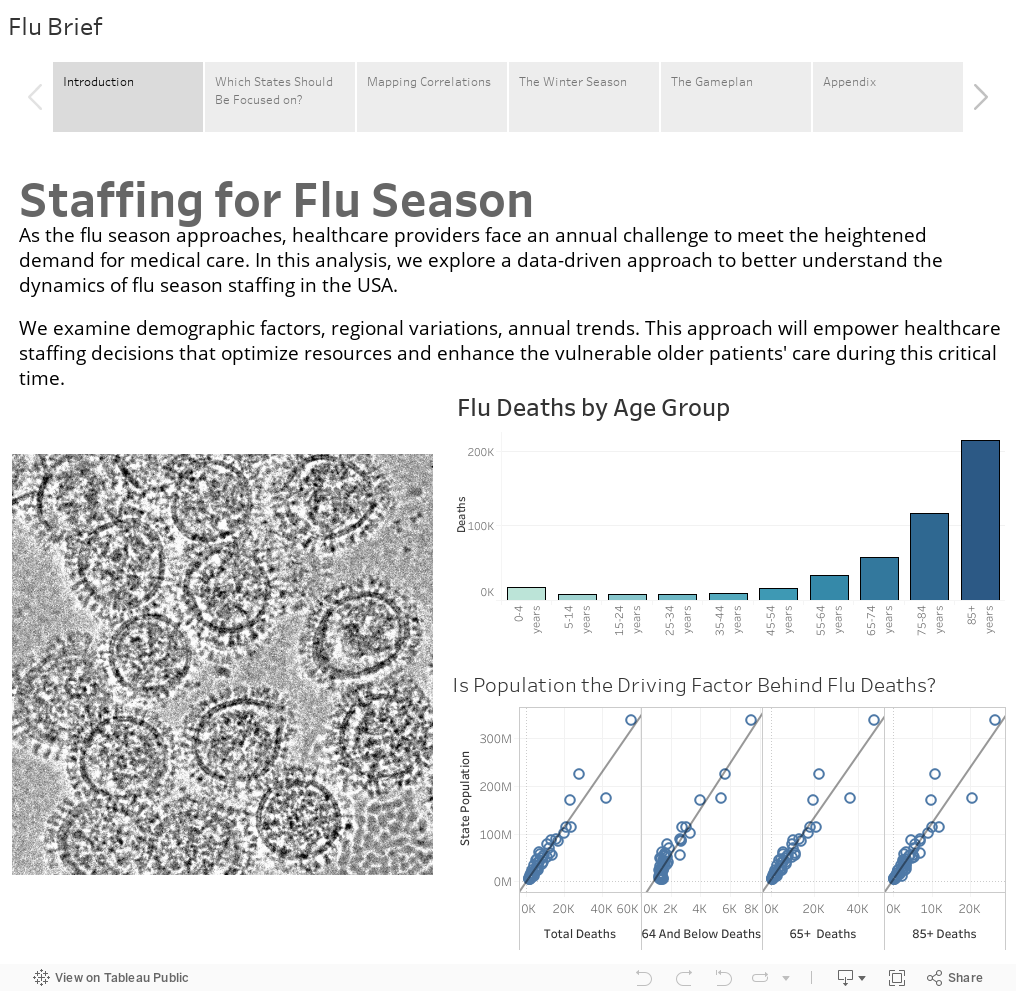
Initial analysis of flu deaths by age reveals some interesting findings. Older age groups are overrepresented in high
monthly flu deaths, but each age cohort has a somewhat stable distribution of low count flu deaths.
Hospital Data Research
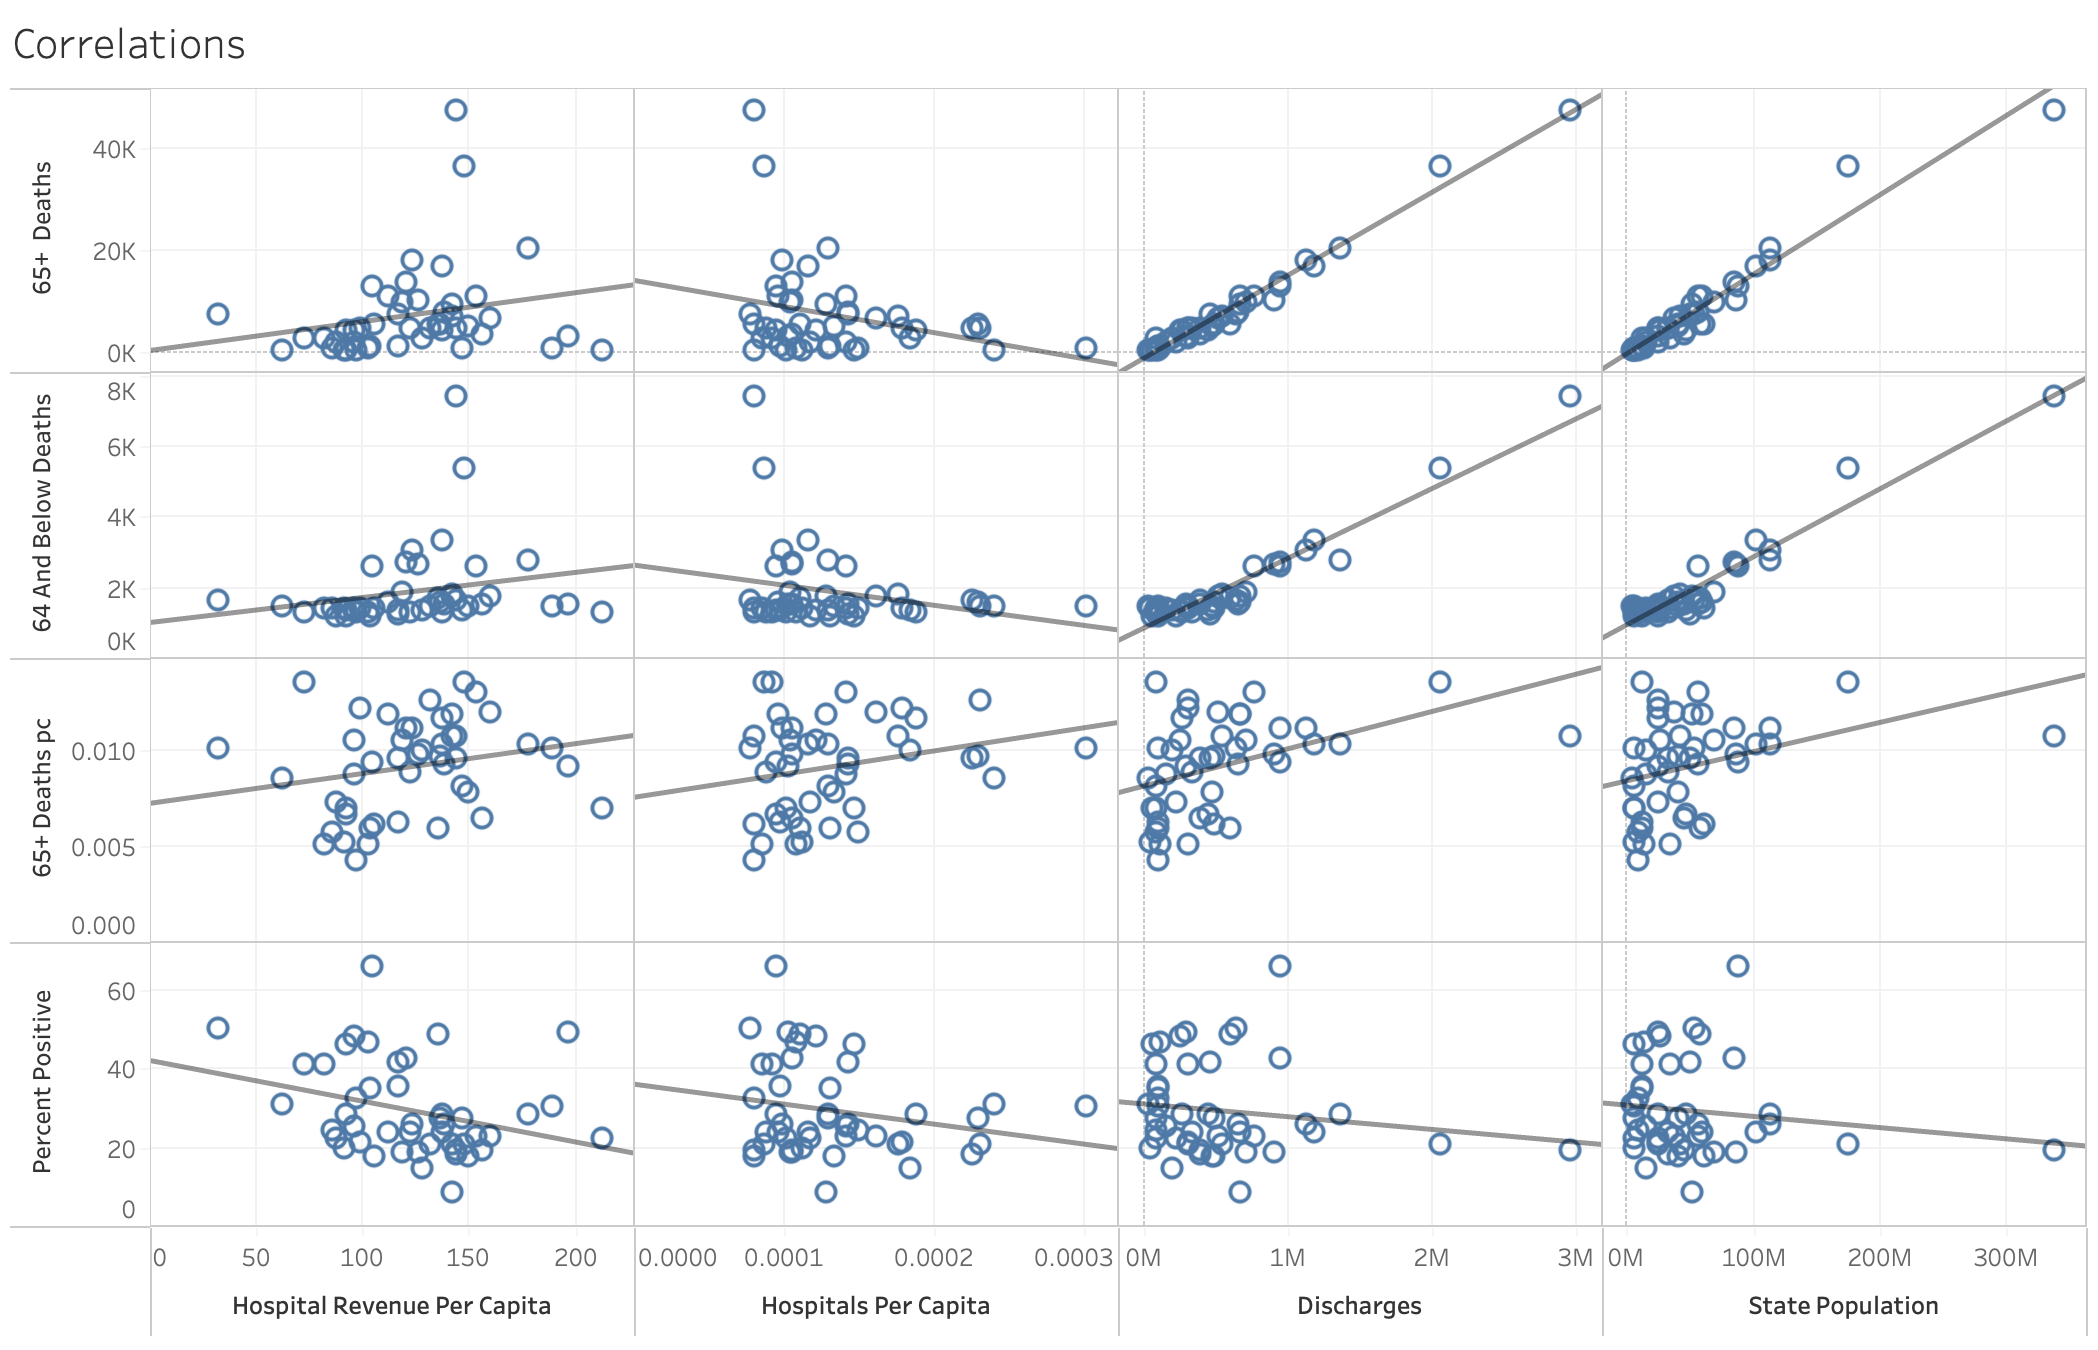
This hospital data proved little except the correlation between state population and hospital revenue, as shown below.
As shown above, hospital revenue is highly related to hospital discharges, which is highly related to
state population. A multivariate analysis of many such correlations indicates that the most vulnerable states
are indeed states with higher populations.
Though these states may have lower population adjusted flu deaths,
the flu season's overall burden on the healthcare system is great enough to merit staff allocation.
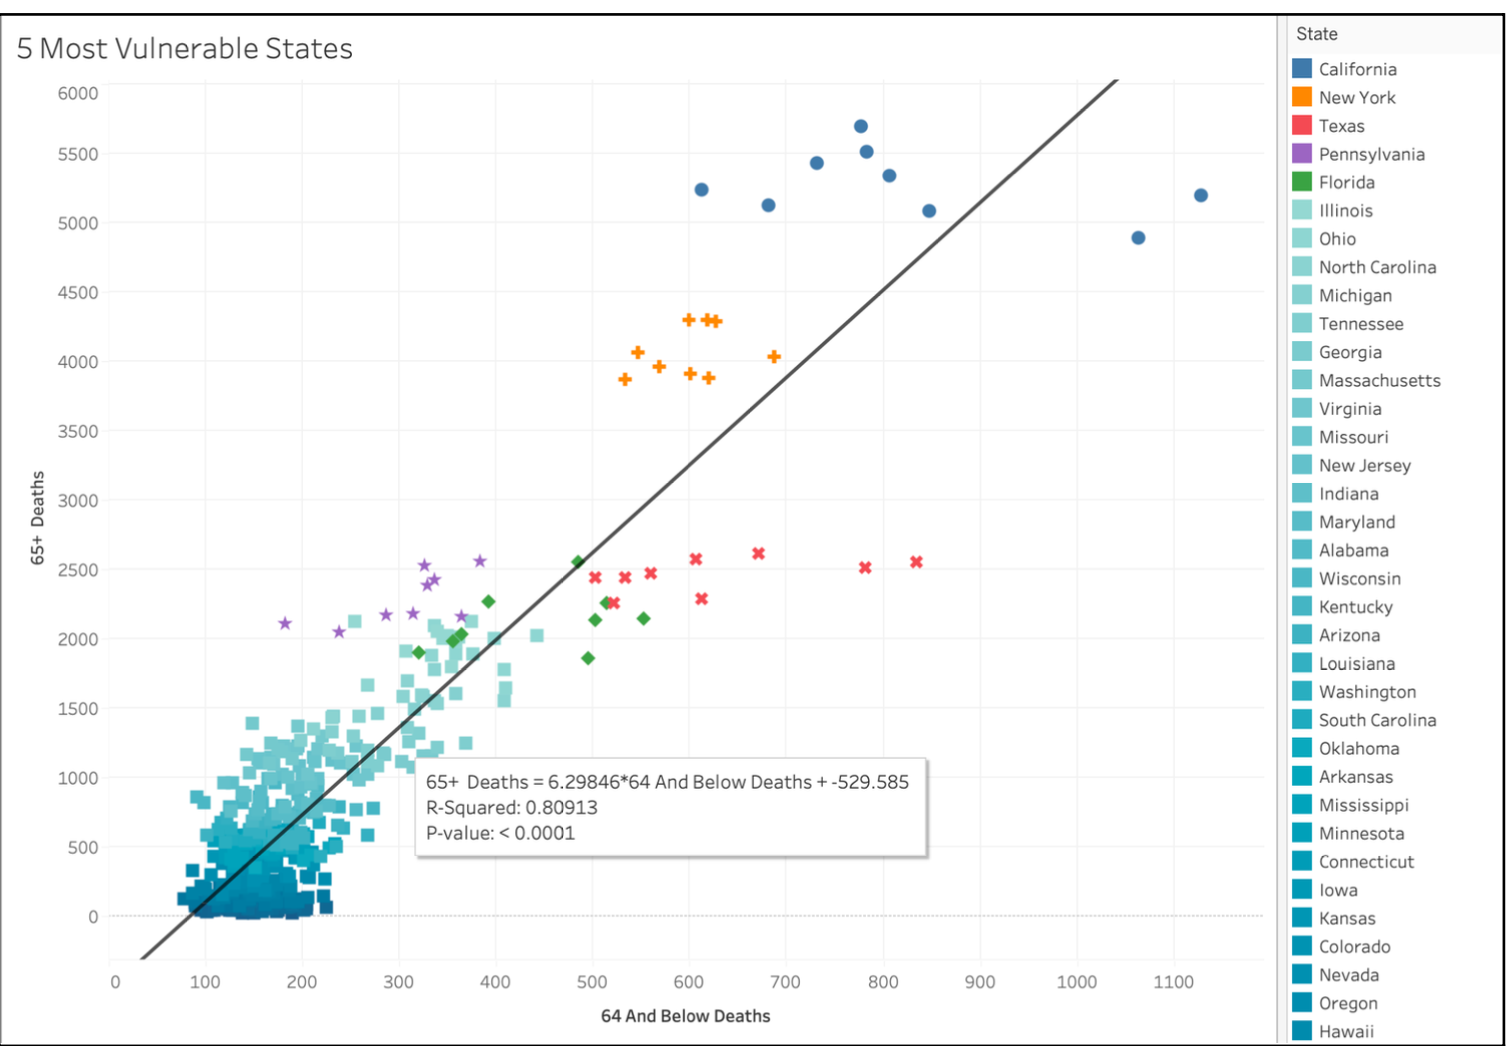
Vulnerable State Analysis
There are two separate lenses with which to look at flu vulnerability.
What should be focused on
Top states in population adjusted mortality (WY, SD, ND, VT, HI, DC)
Top states in overall deaths (CA, NY, TX, PA, FL)
The main reasoning behind not using population adjusted mortality is that those states are very low in population. Below shows the highest overall
vulnerability among states.
Influenza Tableau Dashboard
Manzano Analytics: Influenza Staffing Strategy
Lessons Learned:
Data Research and Merging Datasets
I wanted to identify the most vulnerable states during the flu season, and so I researched data on hospital
revenue and staff on a statewide basis. Data analysis projects typically involve exploring various avenues,
some of which may not yield significant findings or insights. I merged the datasets directly in Tableau. While
initially focusing on revenue, the analysis revealed that population size significantly influenced revenue. In other words,
looking at hospital revenue or staff was just a derivative of statewide population. States with larger populations
tend to generate higher revenue to accommodate the greater demand for healthcare services.
Correlational Analysis with Tableau
The central question of the analysis revolved around understanding the relationship between flu deaths and population density.
Flu deaths per capita were highest in very low populated
states, which experienced low overall flu deaths. These flu deaths in low populated states were also more contributed to by the
younger age groups, below 64 years. At first glance, this may indicate a greater need in low populated states for extra staff,
extra vaccine campaigns, etc, during the flu season. However, this overlooks the significant number of flu deaths in densely
populated states like California and New York, as well as the high vaccination rates per capita in sparsely populated states
like Vermont and Wyoming. In summary, this analysis underscores the population-driven nature of flu-related dynamics across different
population densities. By integrating these insights into public health strategies, we can strive for more equitable and effective
healthcare outcomes for all communities.
Bank Churn Modeling
A mock dataset to model customer loyalty with Machine Learning.