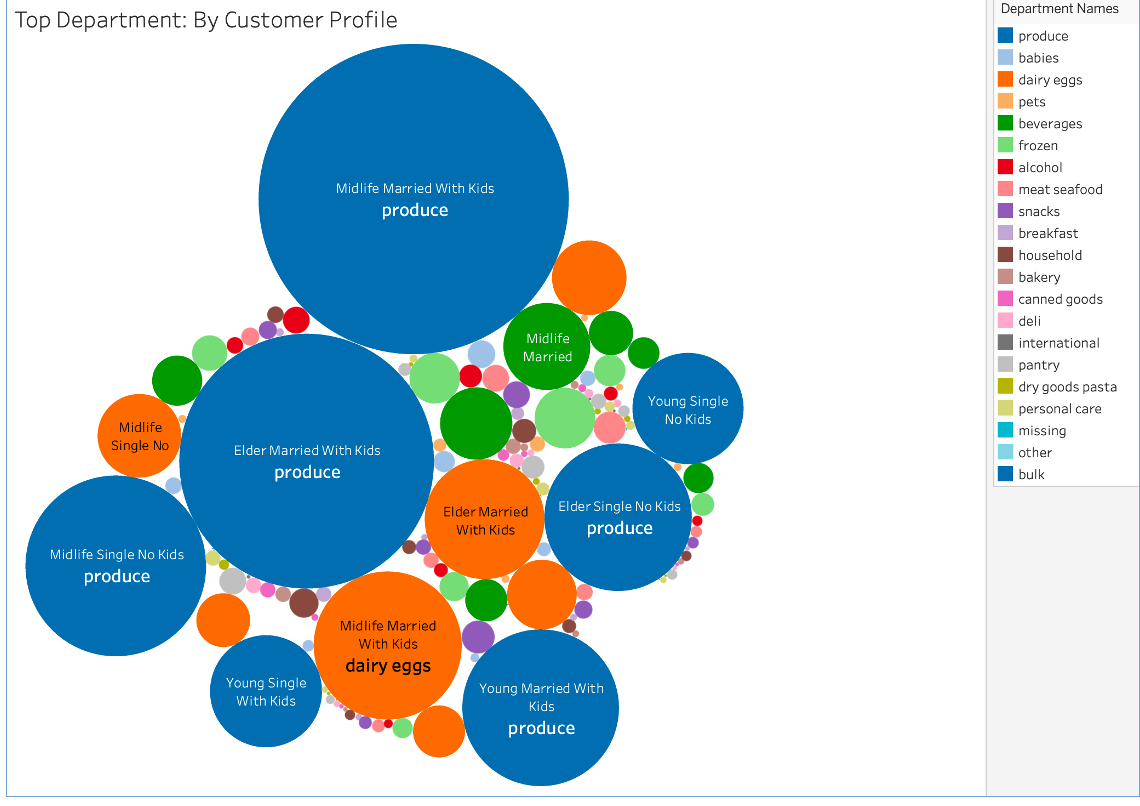
Instacart Customer Segmentation
Using Python and Tableau to understand customer spending behavior and drive revenue in multiple ways.
Learn more
Boasting a 40% CAGR over 6 years...
Data Alchemist | Investment Manager
Data analytics isn't just the new oil; it's also the map of a New World. In the complex landscape of modern data analysis, we are bearing the fruits of deep understanding sown by the father of semantics, and Korzybski's words ought to ring truer than ever. Maps are not the underlying territory, words are not the underlying reality, and data insights are not the underlying decision landscape. A map is only a reflection of the territory, and so we tread carefully, knowing we are driving through the rear-view mirror. It takes a keen eye for detail and a steadfast approach to avoid being fooled by randomness. Separating the noise from the signal, engaging in statistical analysis, and employing predictive modeling are what I do best--gleaning actionable insights motivates and enlivens me.
My expertise lies in deriving real strategic value from the intricacies of data, a skill honed over years of navigating its complexities. This ability seamlessly aligns with my creative vision and long-term goals, driving me to seek out dynamic teams at the forefront of data-driven innovation.
I’m eager to bring these skills and more to a collaborative environment dedicated to pushing the boundaries of data solutions. Let's connect and explore how my unique perspective can elevate your team's success.


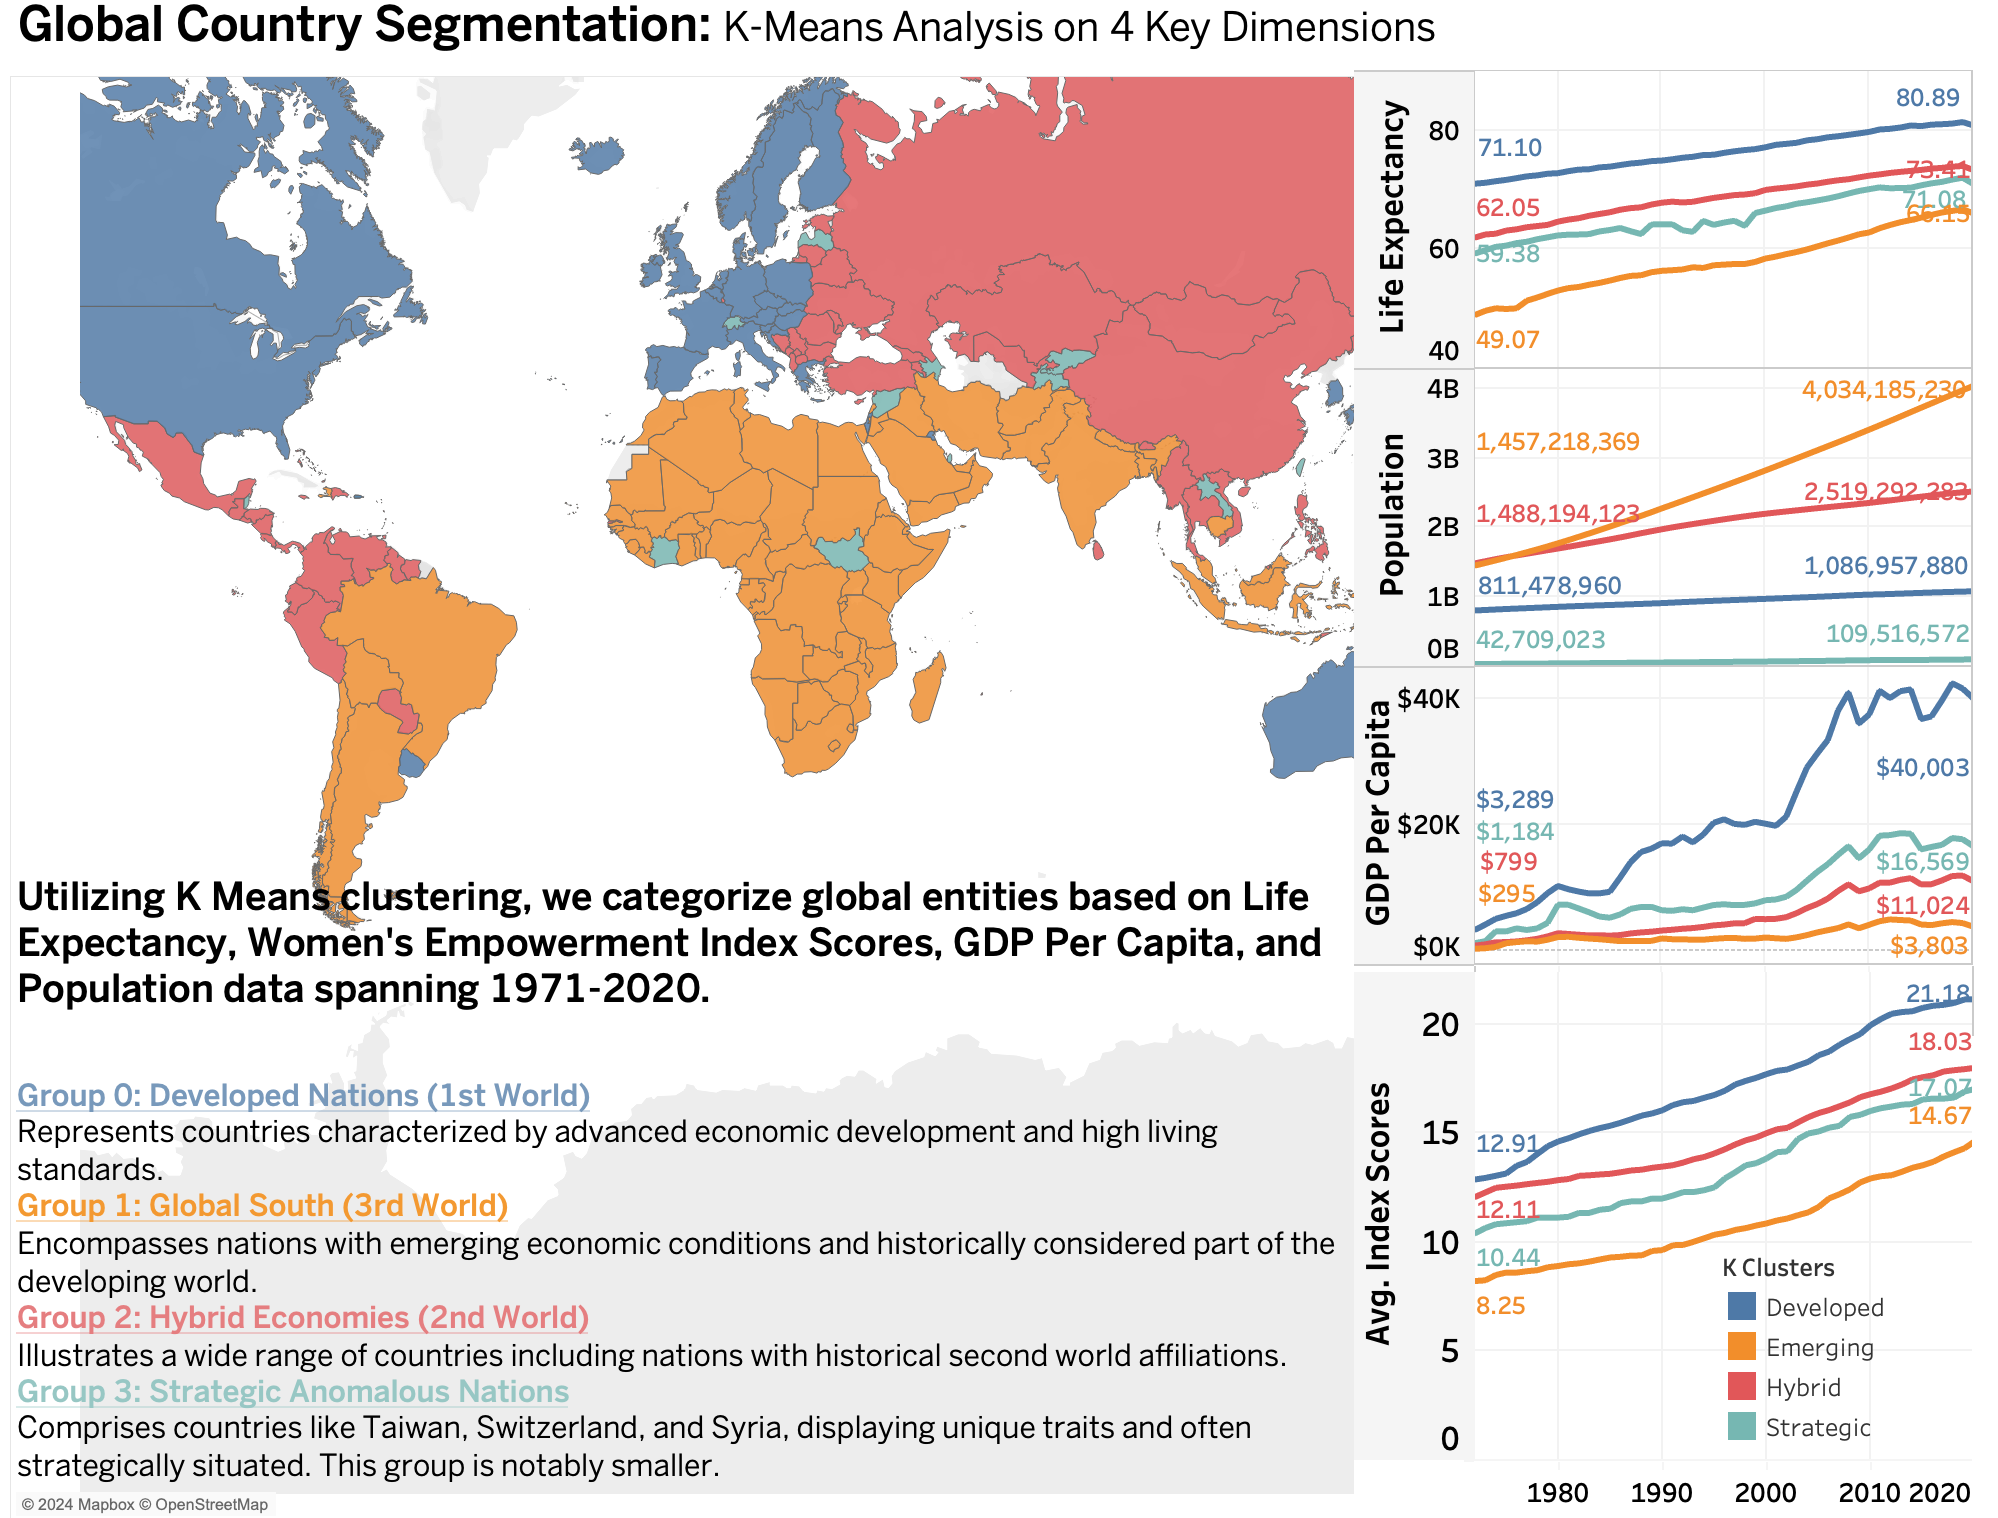
This is a five-decade examination of the interconnection between the Global Women's Empowerment Index and GDP Per Capita. The central proposition suggests a mutually reinforcing association between economic well-being and Women's Rights. Nevertheless, our unwavering dedication is to adopt a rigorous, data-centric approach, unveiling noteworthy discoveries.
Learn more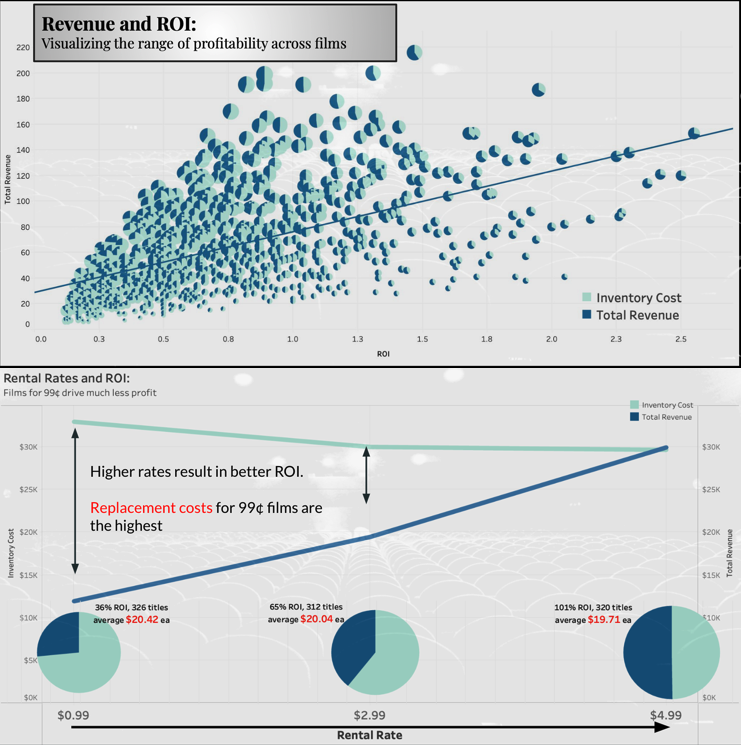
This cost-benefit analysis is in a context of a fictional, globally operating movie rental business on the brink of expansion. Its primary goal is to employ strategic decisions that result in an augmentation of overall profitability. eXtreme Gradient Boosted decision tree modeling is employed, and feature importance values are used to guide the interpretation of the machine learning insights.
Learn more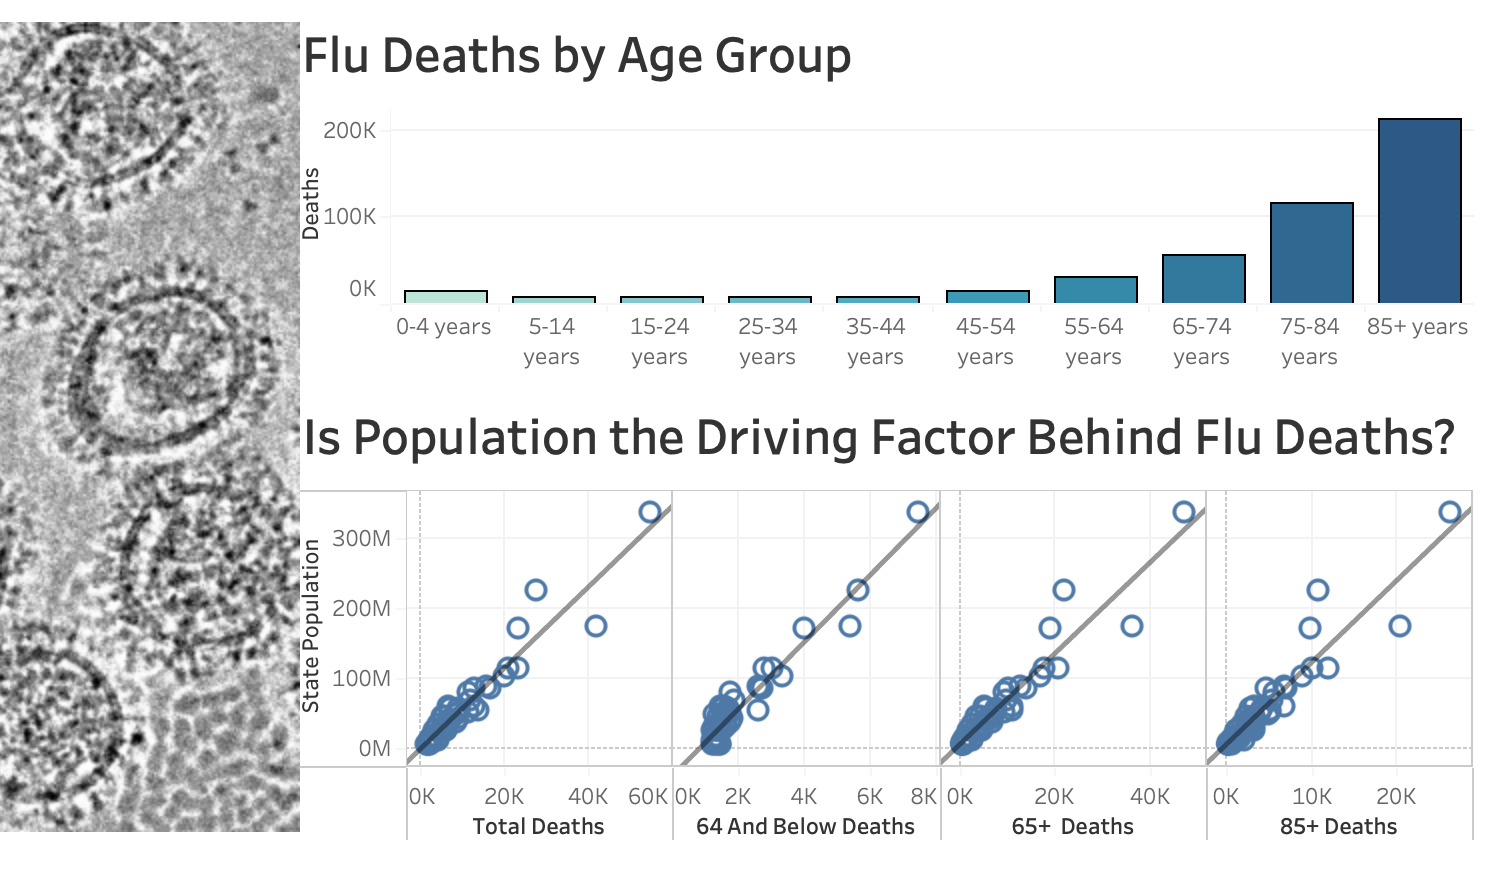
Every year, hospitals are faced with staffing challenges due to the influx of influenza patients. This prescriptive analysis uses USA CDC data and seeks to define and direct staff from low-need states to high-need states.
Learn more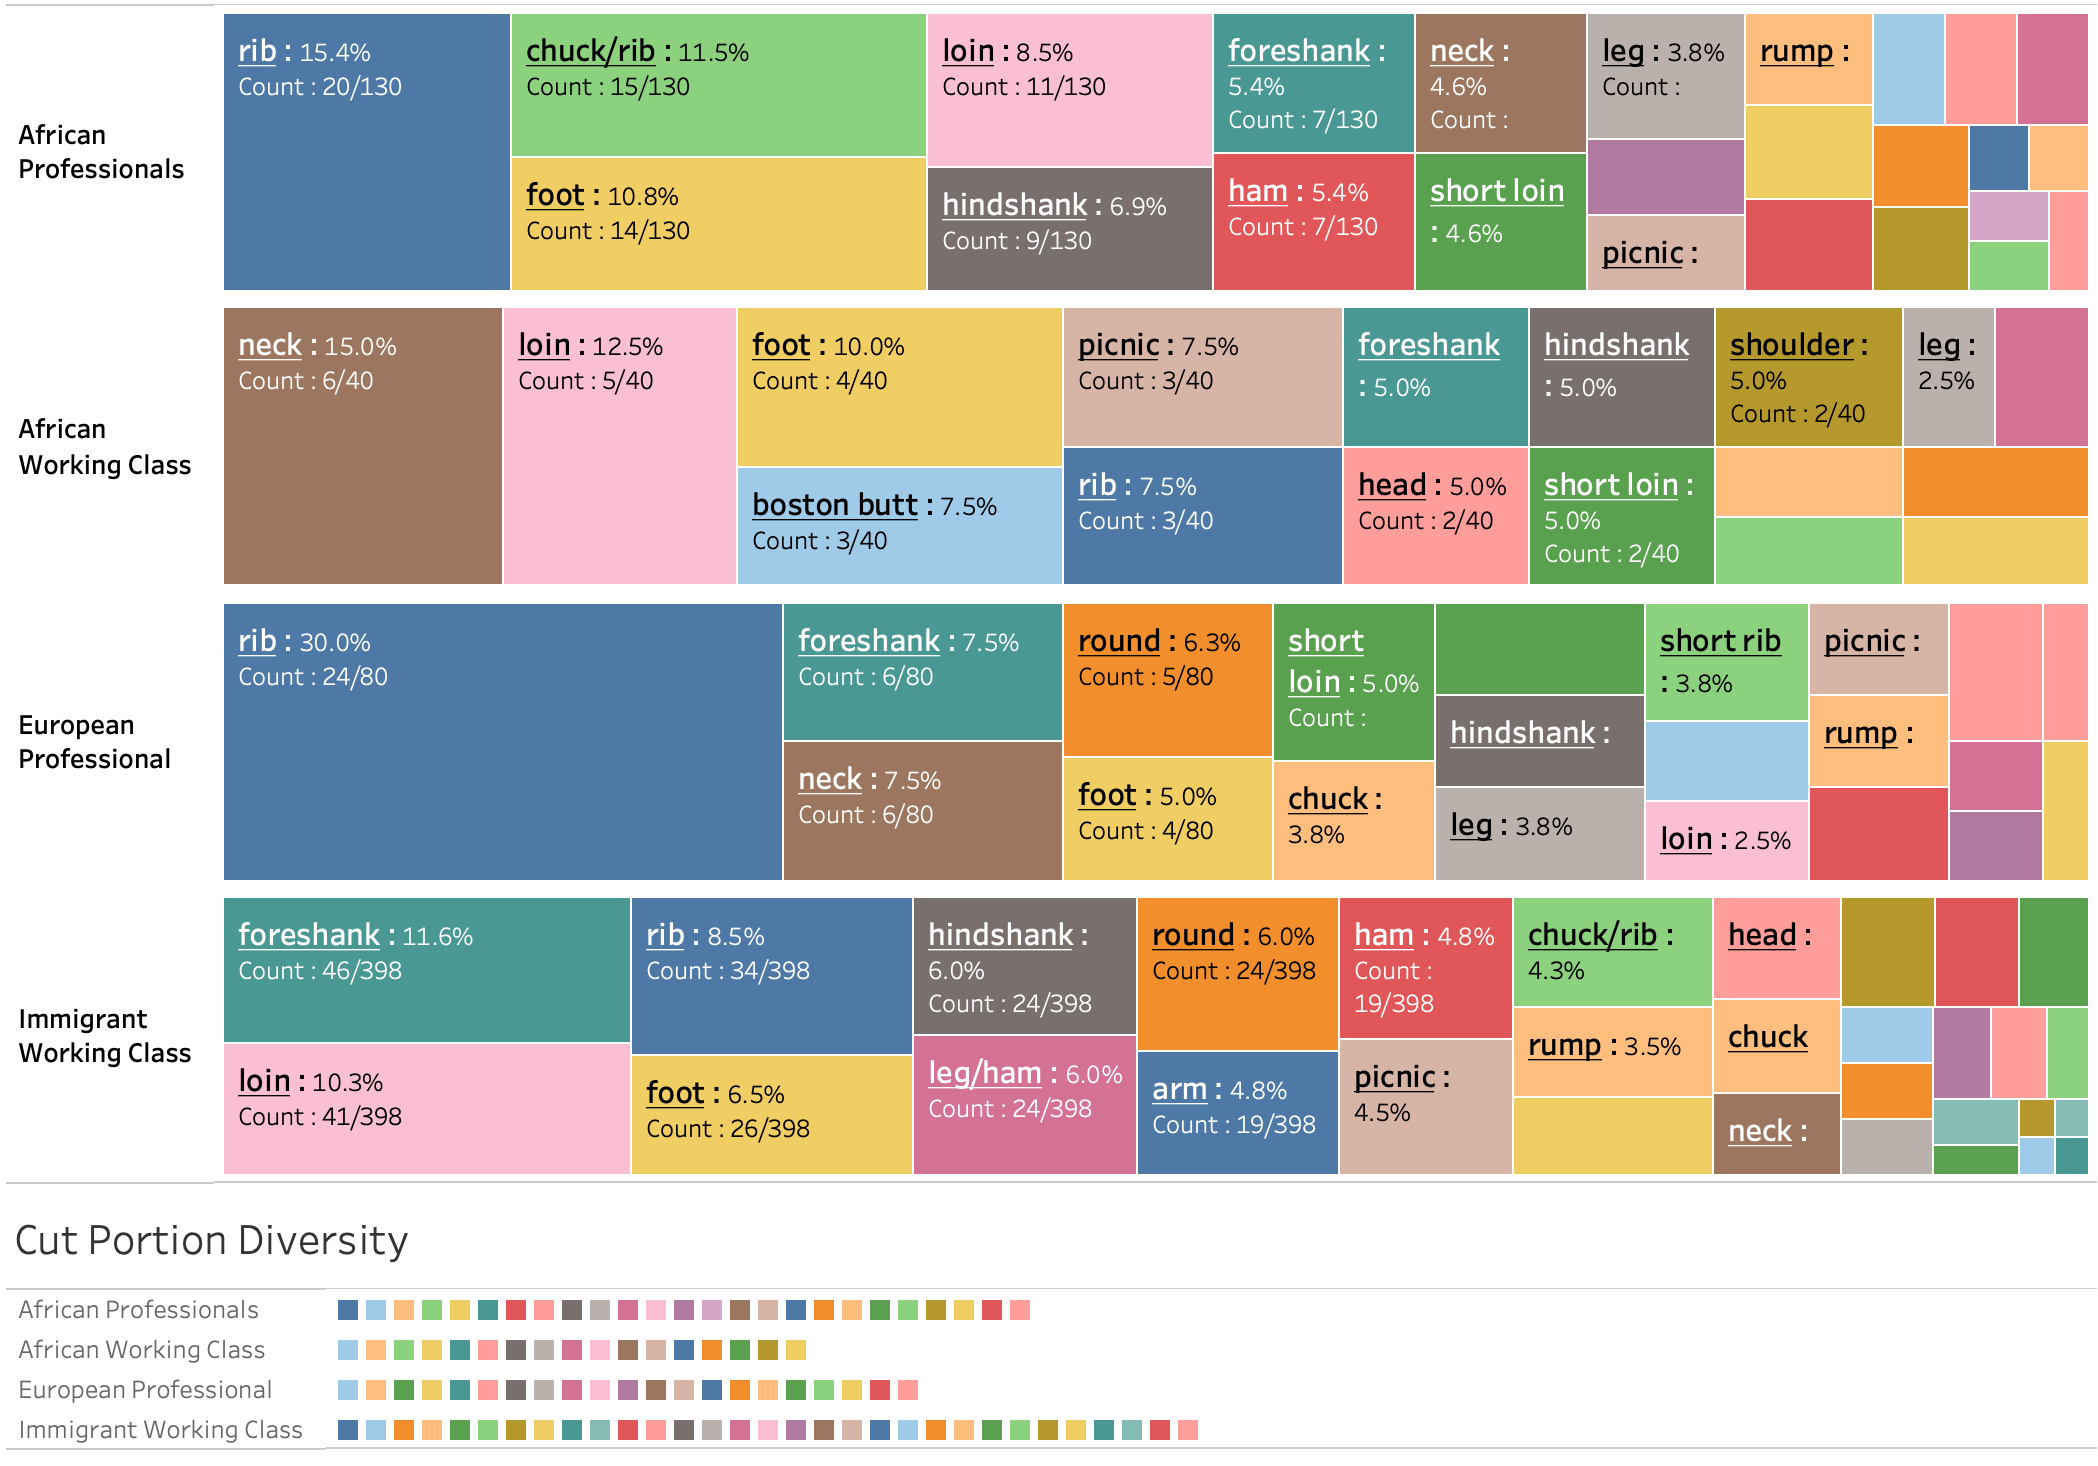
A descriptive analysis of animal bones from a Historic Archaeological site in Louisville, Kentucky.
Learn moreI've actively contributed to a diverse array of Data Analysis projects, refining my proficiency in Python, adaptable problem-solving, statistical methods, and insightful data visualization. Leveraging tools such as:
I’ve informed decisions to improve profitability by up to 80% annually. In finance, my expertise in instrument research, competitive strategy, and statistical modeling led to a 40% CAGR over six years, showcasing my ability to navigate dynamic markets with critical thinking and strategic planning. During my time in technology sales, I was relied upon for responsibilities on and off the sales floor and enjoyed sales training and team building. Monthly KPIs were commonly exceeded by over 50% through quantitative research, effective communication and psychosocial analysis.
Further analysis using Python, Tableau, SQL, and Excel. Click for information on process and final deliverables.
Using Python and Tableau to understand customer spending behavior and drive revenue in multiple ways.
Learn more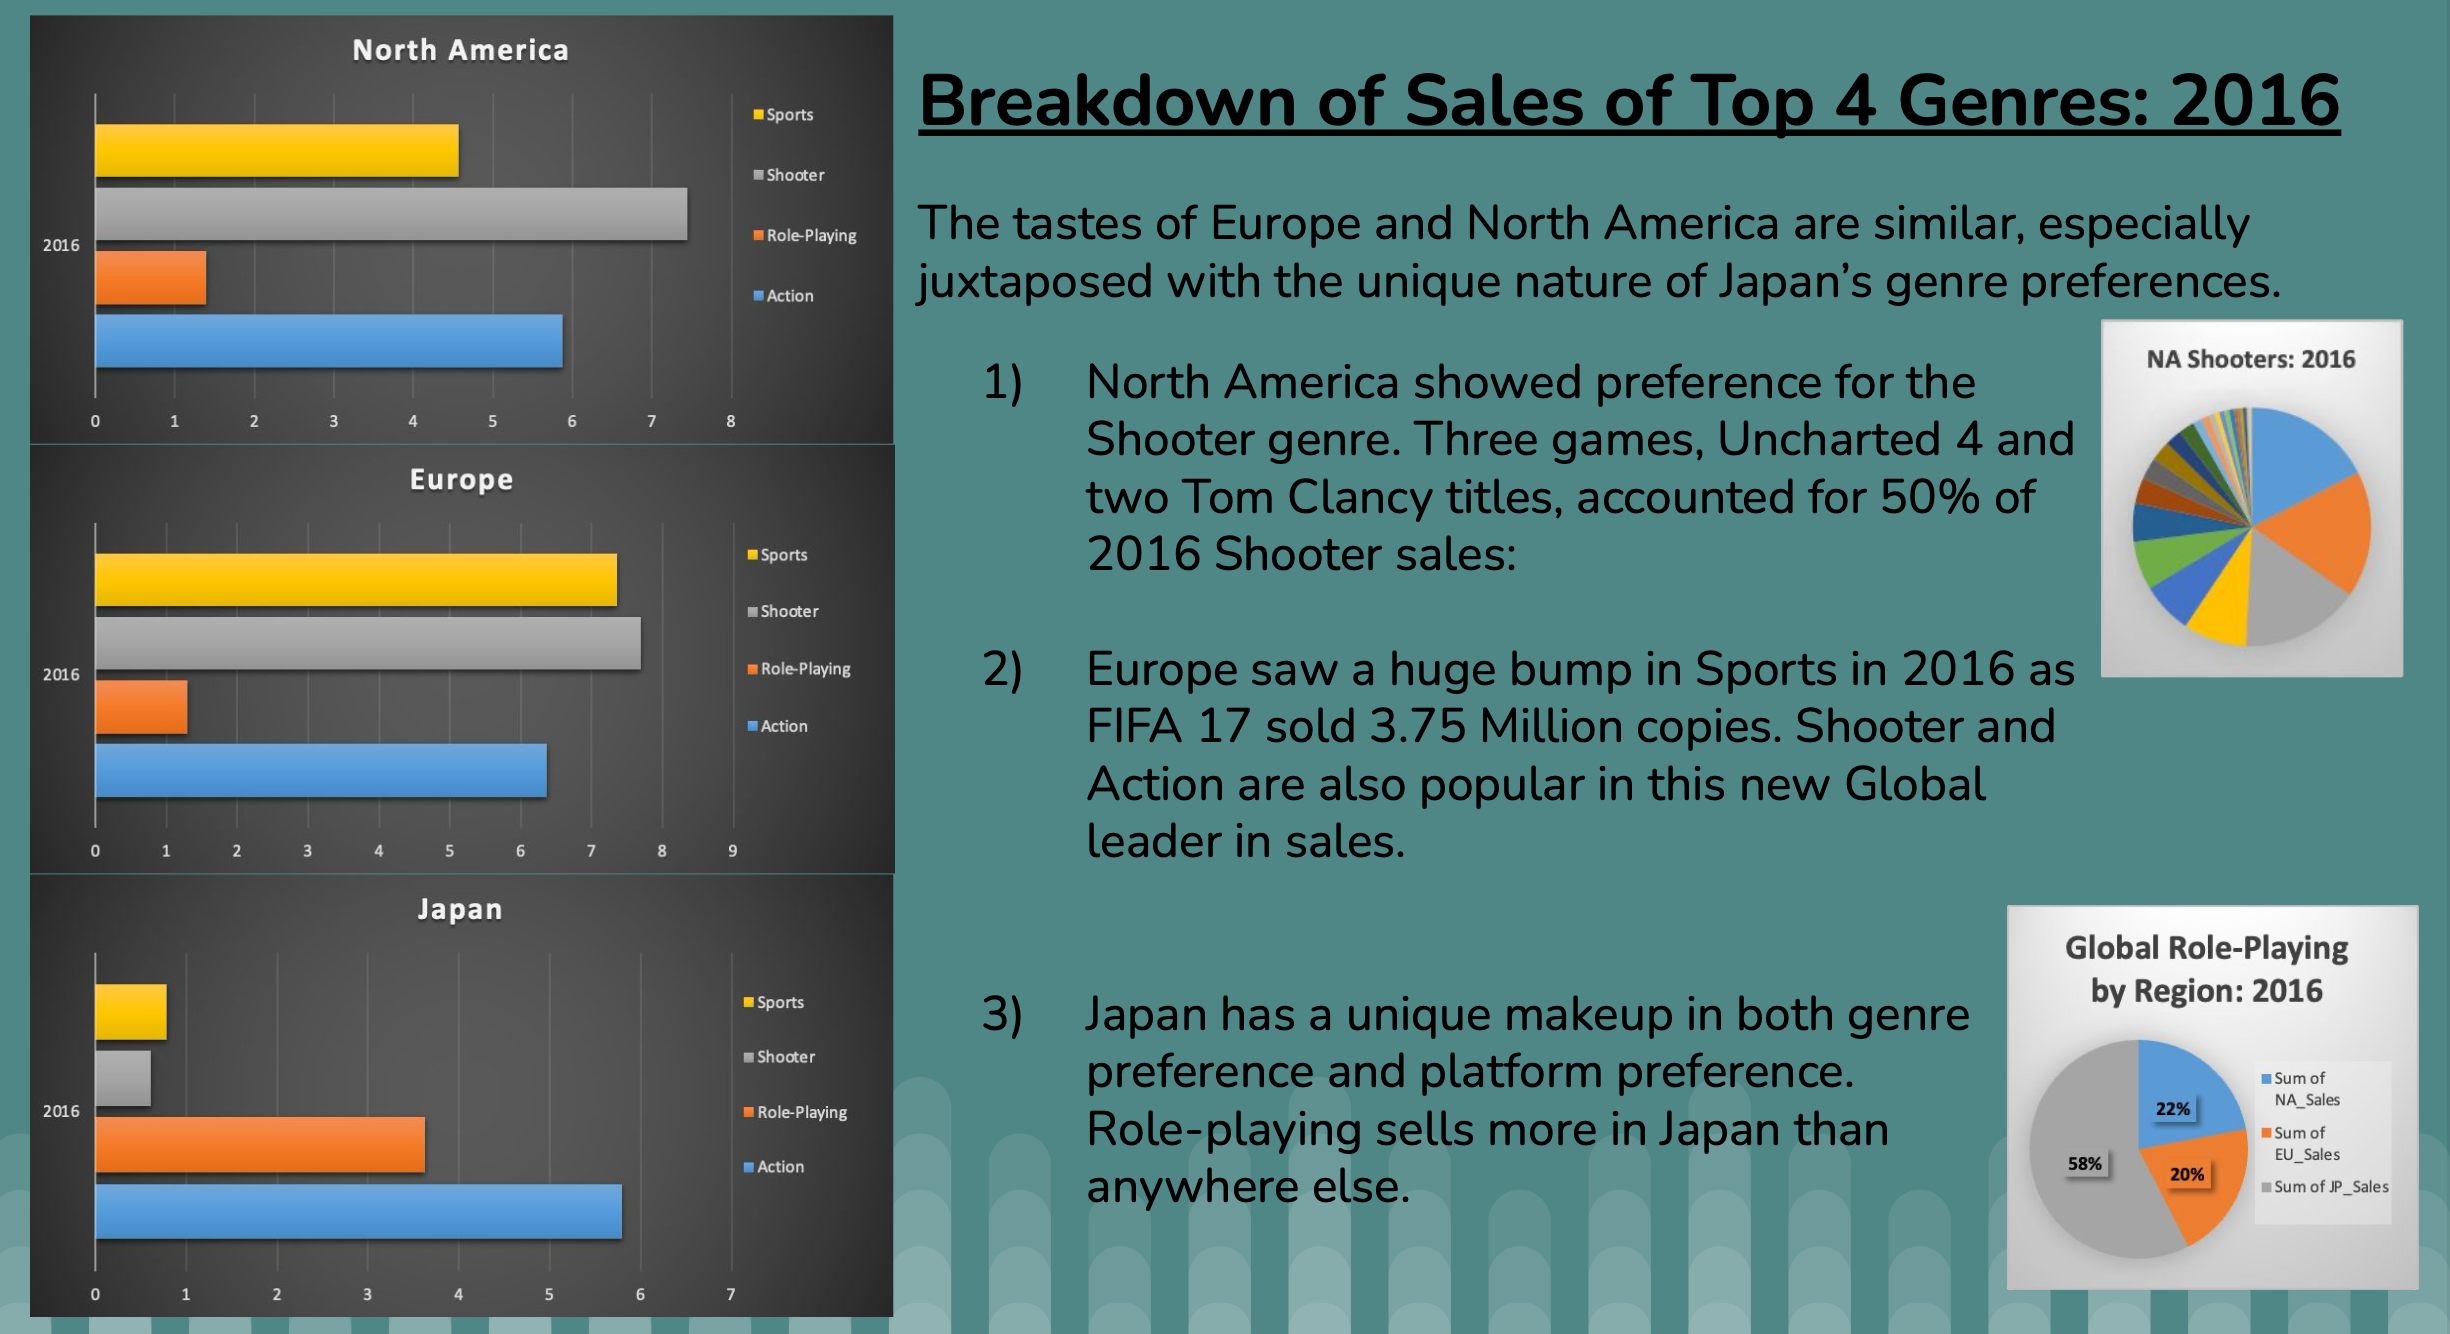
Multivariate Excel analysis of video game sales to inform a successful marketing strategy for North America, Europe, and Japan.
Learn more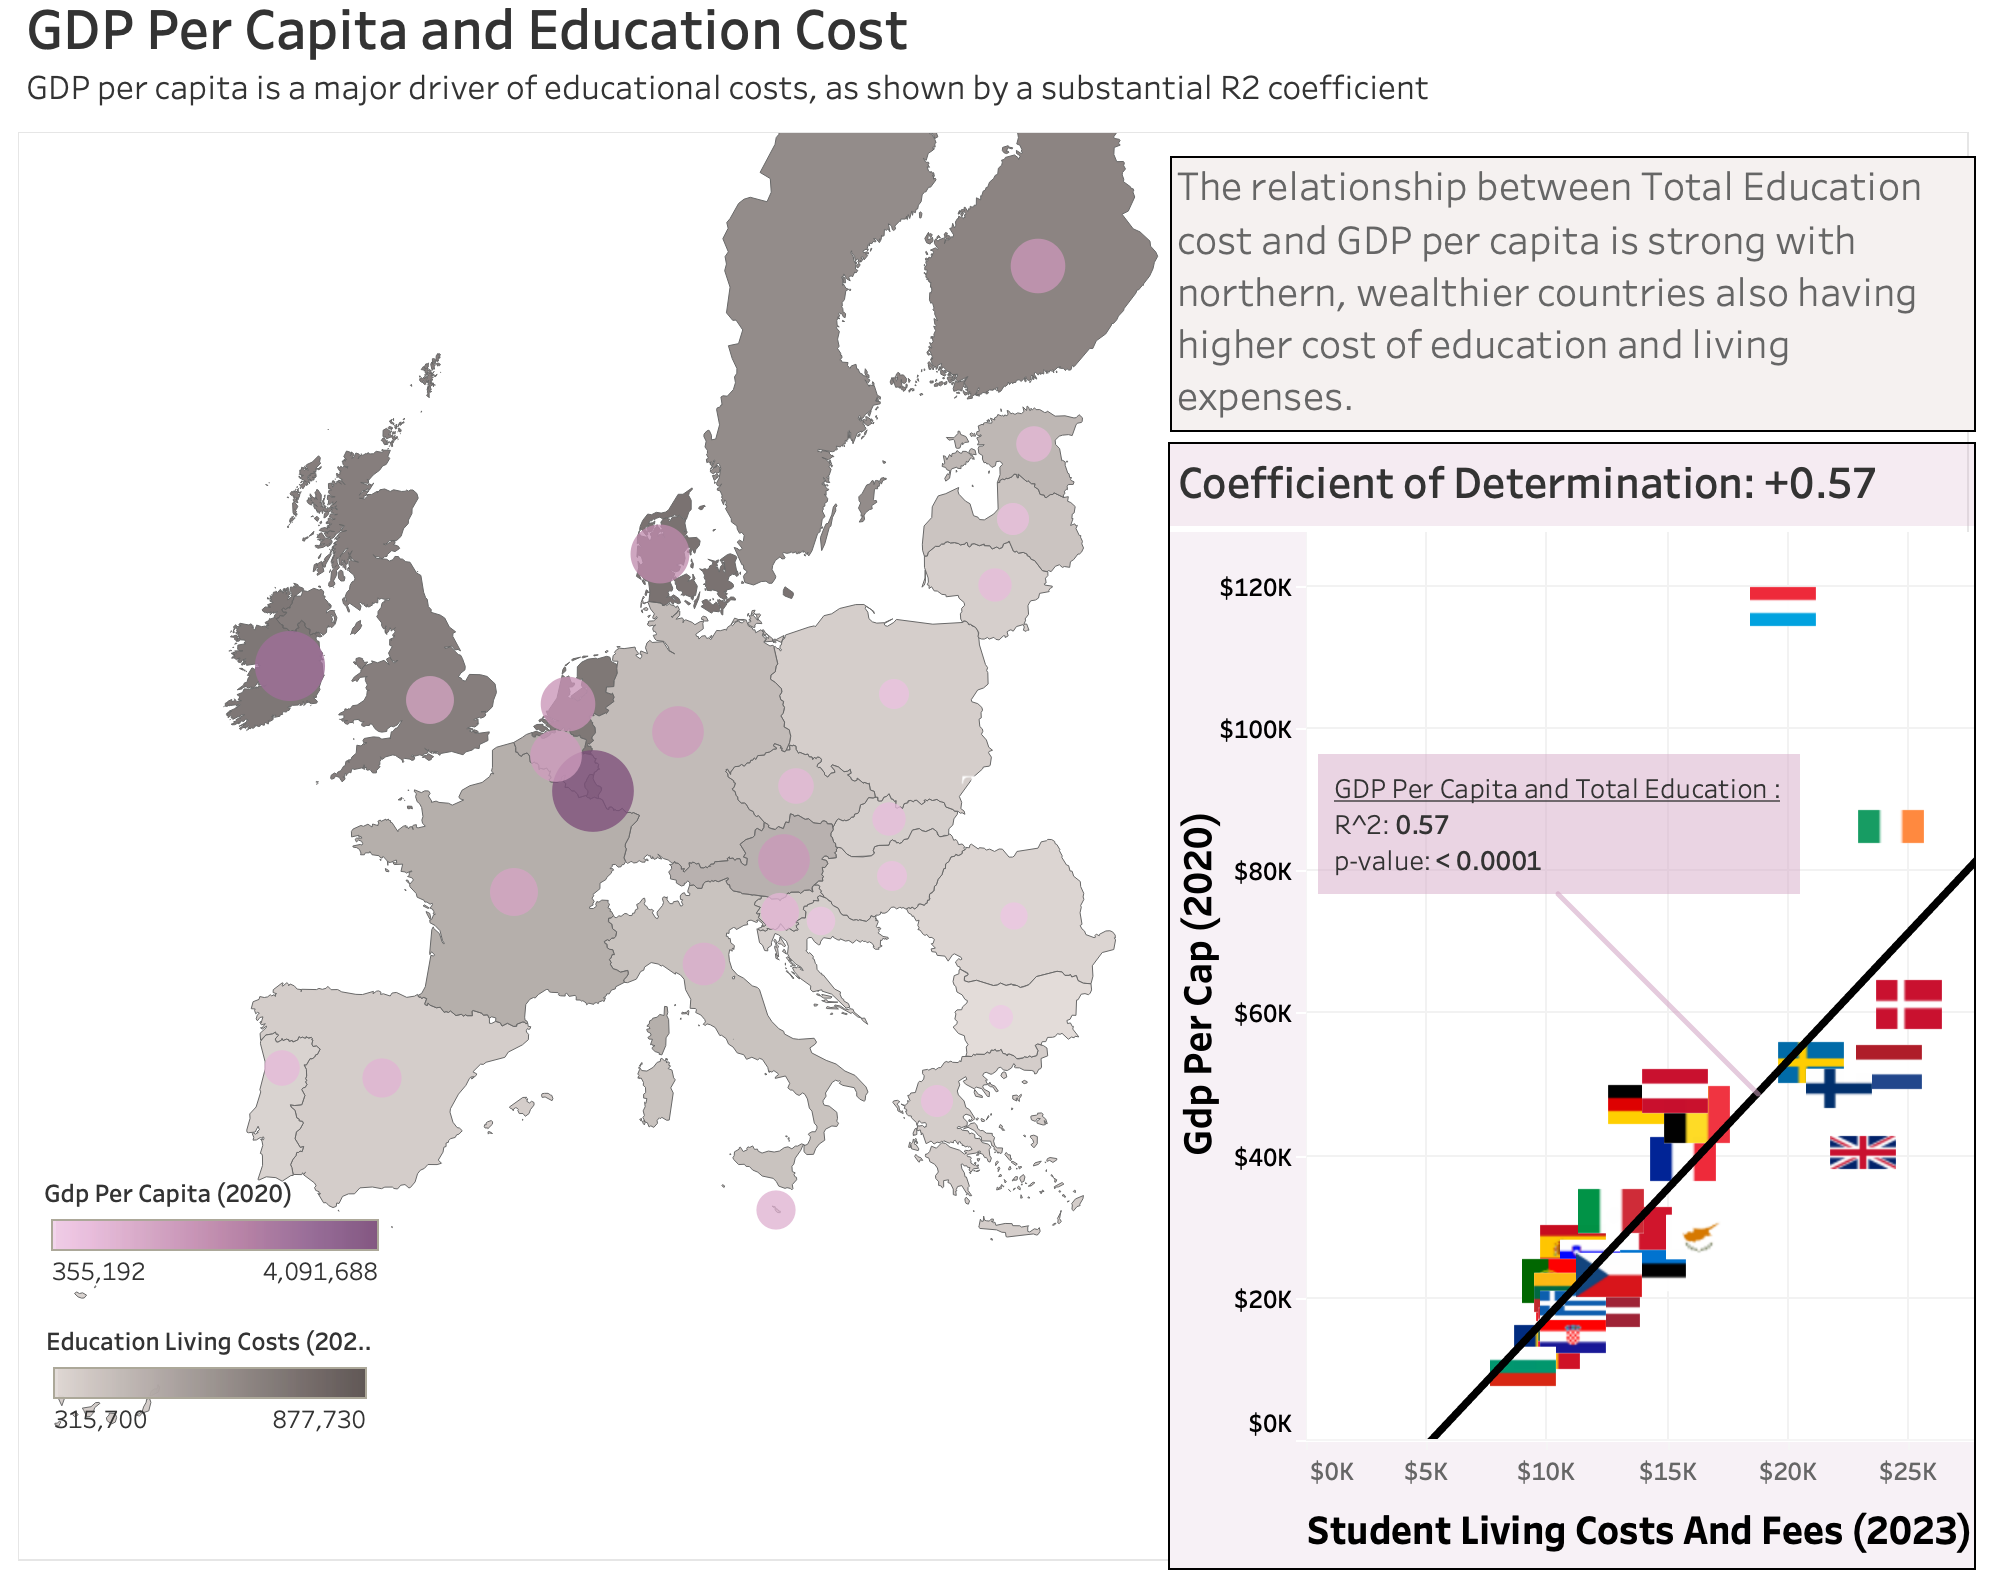
Using Python to prepare data for a Tableau dashboard illustrating the relationship between GDP per capita and higher education cost.
Learn moreModeling customer behavior with Python's XGBoost library and SHAP values for feature importance.
Learn more
As a versatile data analyst and seasoned investment manager, my successful background in finance, energy, and telecommunications uniquely equips me with a valuable skill set for applied data analytics.
My ultimate goal is to secure a full-time data analyst position, leveraging my diverse skill set to contribute meaningfully to your team's success. Let's connect and explore how my exceptional background can drive insights and innovation in your organization.